For a long time I have been deeply worried about the looming threat of climate change and its broad consequences. But greenhouse gas emissions from human activities are just one part of a complex picture in which we (human beings) are damaging our environment so severely that the future of our life on Earth uncertain, and this uncertainty is within the timescale of our children’s lifetimes. Indeed, there is some degree of consensus that we are heading for some form of societal collapse. In this note, I wanted to try and articulate the complex picture of human impacts on nature as a way to reflect on the situation in which we find ourselves in, and provide something to navigate the stream of environmental bad news that we receive. The information in this note is drawn primarily from recent significant reports that focus on global impacts, linked at the end.
Nature’s biodiversity and ecosystem services
Nature is the rich variety of life and environments found on Earth, but because of human impacts it is in decline.
The 2019 UN Global Assessment Report on Biodiversity and Ecosystem Services is the work of an intergovernmental body and represents the most comprehensive assessment of life on earth ever completed. The report finds that human activities have caused huge declines in terrestrial, freshwater and marine environments. Across an estimated eight million known animal and plant species, approximately one million are currently threatened with extinction. This rate of extinction is estimated to be 10 to 100 times higher than any of the previous known five mass extinction events in the history of Earth, thus it has been named the Holocene extinction, characterising the current geological epoch.
The WWF Living Planet Report 2020 provides a similarly stark assessment of the state of the world’s ecosystems and lifeforms: between 1970 to 2016 there was been an average decline of 68% in populations of mammals, birds, amphibians, reptiles and fish according to the ‘Living Planet Index’, which aggregates data from 20,811 populations representing 4,392 species globally and does not include insects. Rates of decline vary significantly by region, with the highest average declines in tropical regions (94% of vertebrate populations in Latin America and the Caribbean).
A 2018 study found that of all mammals on Earth, 96% are livestock, 36% are humans and only 4% are wild animals. Of birds, 70% are poultry and 30% are wild. These proportions correspond to intensification of animal agriculture with losses of 83% of wild terrestrial mammals, 80% of marine mammals, 50% of plants and 15% of fish.
The issues of biodiversity and ecosystems are central to the functioning of our planet and to our health and wellbeing. Biodiversity relates to the variety of genes, species and functional traits in an ecosystem, which is defined as a community of living things in an environment, all interacting as a system. It is recognised that biodiversity affects the functioning of ecosystems, the flows of energy, materials, minerals, and water. At a high level, all ecosystems are powered by the sun’s energy that is captured by photosynthesis, and this energy is transferred upwards through the food web. The movement of nutrients occurs as living organisms exchange them though their interactions with the physical environment.
Humans too are part of an ecosystem, depending on plants and organisms to capture the sun’s energy and convert it into edible products. However, human activities such as agriculture and forestry management can be seen as ways of manipulating our ecosystems to increase the output of particular provisions. Unfortunately, such interventions have effects that are detrimental to other aspects of ecosystem functioning.
Apart from the wonder and beauty of the natural world and a sense that it should be respected and preserved, biodiversity can be viewed through a more functional lens as providing services for the benefit of humans, and indeed our survival. These ecosystem services can be broken down into four groups: provisioning, regulating, support and cultural, summarised in the following table. According to the Global Assessment Report, the trend of 16 of these 19 categories is that decline over the last 50 years. Only energy, food, and raw materials have seen increases in the level of provisioning to humans. However, these service benefits directly impact other services due to dramatic changes in land use and associated air, water and soil pollution.
| Group | Service | Historical 50-year trend | Details/examples |
|---|---|---|---|
| Provisioning services that support the production of renewable resources. | |||
| Food and feed | Increase | Such as crops and fisheries, feeding humans directly and indirectly with livestock. | |
| Energy | Increase | Such as biofuels. | |
| Raw materials | Increase | Such as wood for construction and natural fibres for clothing. | |
| Freshwater | Decline | Water is essential for human life and for the cultivation of crops. | |
| Medicinal, biochemical and genetic resources | Decline | For example, new antibiotics are discovered in nature, rather than being created artifically. | |
| Regulating services that lessen environmental change. | |||
| Regulation of climate | Decline* | By sequestration of carbon dioxide to reduce the effects of global warming. *The capacity of the oceans to do this has remained constant in this period. | |
| Regulation of local climate and air quality | Decline | Examples including shade from trees, forests influencing rainfall and plants regulating air quality by removing pollutants. | |
| Moderation of extreme events and natural disasters | Decline | Such as floods, storms, tsunamis, landslides and droughts. | |
| Regulation of freshwater and coastal water quality | Decline | Such as treatment of waste water to eliminate harmful pathogens. | |
| Regulation of freshwater flow | Decline | Which affects the quantity, location and timing of freshwater. | |
| Regulation of soil fertility and prevention of soil erosion. | Decline | Fertility refers to the ability of soil to sustain plant growth, and erosion is the displacement of soil, most immediately impacting crop production. | |
| Biological control of disease and pests | Decline | Such as by the control of the population of a species that acts as a vector for a disease by another, perhaps predatory, species. | |
| Pollination of plants | Decline | To enable reproduction of many plants. | |
| Supporting services that provide a basis for all ecosystems and their biodiversity with habitats and genetic diversity. | |||
| Soil formation | Decline | To provide a habitat for many types of plant. | |
| Nutrient cycling | Decline | To provide the necessary mineral nutrients, including water, to organisms. | |
| Cultural services are non-material human benefits. | |||
| Recreation and mental and physical health in natural spaces | Decline | Such as walking, running or sports in a park. | |
| Tourism though the enjoyment of nature | Decline | Benefiting those experiencing nature, as well as providing income for those facilitating it. | |
| Aesthetic appreciation and inspiration for culture, art and design | Decline | Much of culture, art and design draws on the natural world. | |
| Spiritual experience and sense of place | Decline | Nature is a common element of most religions. |
Since 1970, the global population has more than doubled (3.7 billion to 7.6 billion), global trade has increased ten fold and average GDP has increased four fold. It is estimated there has been a 15% per-capita increase in consumption globally and this is compounded by increasing levels of long-distance goods transportation. Increased consumption, along with technological development, has driven increased production of food, materials and fuels, and has driven urbanisation, which is reflected in global statistics:
- Crop production has increased 300% since 1970.
- Timber production has increased by 50% since 1970.
- Extraction of resources has almost doubled since 1980.
- Urban areas have more than doubled since 1992.
Consequently, the primary driver of biodiversity loss in terrestrial and freshwater ecosystems is land-use change, closely followed by direct exploitation through harvesting, logging and hunting. In marine ecosystems, direct exploitation through fishing is the primary driver, followed by land-/sea-use change. Together these issues account for more than 50% of the global impact on nature, but approximately 30% is this is attributable to three other significant factors: climate change, pollution and invasive alien species.
The UN Global Assessment Report summarises human impact thus: 75% of the earth’s land surface is now significantly altered, 66% of the oceans are significantly altered, and global indicators of the condition of biodiversity and ecosystems indicate a 47% decrease from before human impacts, with a continuing decline of approximately 4% per decade.
A recent report by the Swiss Re global insurance company concludes that 20% of the world’s countries are at risk of their ecosystems collapsing due to a decline in biodiversity and consequent ecosystem services decline. (Ecosystem collapse is when processes and features supporting life are reduced or disappear, typically leading to a drastic reduction in the number of organisms living in an environment, and often mass extinction.) Swiss Re frame this decline as a critical issue because they estimate 55% of global GDP depends on high-functioning biodiversity and ecosystem services. The graphic below summarises the global distribution of the problem with an index developed by Swiss Re to compare biodiversity and ecosystem services by aggregating data across indicators. Included in the index are habitat intactness, pollination, air quality and local climate, water security, soil fertility, erosion control, coastal protection, food provision and timber provision.

Terrestrial and freshwater ecosystems

Growth in consumption has driven land-use change and now 33% of the Earth’s land surface is dedicated to crop and animal agriculture. Such is the scale of this production, that it is responsible for 25% of greenhouse emissions (18% for animals and 7% for plants), and it consumes 75% of global freshwater resources. Destruction of habitats is a primary driver for biodiversity loss and the expansion of agriculture has mainly replaced tropical forests, wetlands and grasslands, which are home to the highest levels of biodiversity, as well as providing huge carbon sinks, protecting against extreme weather events and are difficult or impossible to replace.
Compared with pre-industrial times, it is estimated that 30% of global habitats have lost the ability to support long-term survival for the species they accommodate.
Forests cover 31% of the Earth’s land area and harbour most of terrestrial biodiversity, but are distributed unequally. Tropical and subtropical forest accounts for 42% of global cover, of the remaining cover, 24% is in boreal regions and 22% in temperate regions (see the UN The State of the World’s Forests report graphic below).
Globally, it is estimated that there has been a 46% reduction in the number of trees prior to human impacts, and approximately 10 billion trees are now felled annually. This deforestation is driven primarily by agriculture, with secondary factors accounting for <20% of total deforestation being urban, infrastructure and mining expansion.
In Latin America for example, 100 million hectares (or 1 million square km, or four times the land area of the UK) of tropical forest were lost in the period 1980 to 2000, mainly to cattle and palm oil plantations, and this ecosystem destruction continues today, pushing areas of the Amazon to a tipping point where rainforest is converted to open savannah. There is also a strong link between deforestation and the emergence of dangerous novel viruses.
Of the remaining forests, 66% have been subject to human impacts causing significant changes to their ecological processes and ability to naturally regenerate. Forests are being degraded primarily by logging for raw material and fuel, with secondary factors accounting for <20% of total degradation being forest fires and livestock.
Due to the expansion of new forest area, the net rate of forest loss has decreased by 50% since 1990 (an estimated 16 million hectares per year, compared with 10 million between 2015 to 2020), which is encouraging but still falls short of increasing forest cover in the near term to mitigate climate change and to preserve biodiversity. Replacement of old growth forests is not one-for-one: the ability of trees to absorb carbon dioxide improves with age and establishment of new forests also takes decades.


Wetlands are inland areas of water such as lakes, rivers, floodplains, swamps, marshes, peatlands, mangroves and coral reefs, and include artificial areas such as reservoirs and rice paddies. Wetlands provide additional important ecosystem services: water purification and a source of food. More than 85% have been lost between 1700 (pre-industrial times) to 2000, and this has accelerated: the rate of destruction has been approximately three times faster than that of forests with 30% lost between 1970 and 2008. This destruction is driven primarily by land-use change due to agriculture, but also climate change, direct extraction and pollution. Globally, there are now approximately 5.7 million square kilometres of wetlands, or 6% of global land area. Creation of artificial wetlands has also accelerated, accounting for 12% of the total area, with mixed impacts on wildlife.
Once land has been converted to agricultural purposes from pristine habitats, it is further subject to degradation, primarily from intensive practices that do not allow soil to naturally regenerate between harvests and abundantly use chemicals for fertilisation and pest control. Secondary drivers are urbanisation, development of infrastructure, production of energy and mining. The UN’s Global Land Outlook report states that over the last 20 years, approximately 20% of land supporting the growth of plants shows persistent declining trends in productivity (16% of forests, 19% of grasslands and 27% of rangeland). The impacts vary significantly by region, with Africa and Europe having some of the highest levels of land degradation, with effects of future food production insecurity, water insecurity and reduced protection against extreme weather events.
Although land-use change and direct exploitation are dominant factors in the decline of terrestrial nature, the combined pollution of harmful substances and introduction of invasive alien species account for more than 20% of the declines in nature.
Anthropogenic pollution that negatively impacts nature takes numerous forms: chemicals released into the air (including greenhouse gasses causing global warming), contamination of soil and water with chemicals including hydrocarbons, heavy metals, fertilisers and pesticides, as well as raw sewage. Every year into the world’s waters, more than 80% of global untreated wastewater and 300-400 million tons of industrial waste is discharged.
The introduction of invasive terrestrial species have risen approximately 70% since 1970, due mainly to the growth of long-distance transport of goods and people, but increasingly from changing climates enabling habitation in new areas. Alien species can have significant direct effects on new ecosystems because of a lack of natural predators, because they carry diseases and because they outcompete native wildlife or prey on them. They can case indirect detrimental effects through impacting the ecosystem by, for example, changing soil chemistry or the intensity of wildfires. Alien species are a particular problem in marine ecosystems and are discussed in the next section.
Climate change, which is discussed in the final section, has a relatively smaller impact, but one that is increasing rapidly, and simultaneously exacerbating other drivers.
The oceans and marine ecosystems
The oceans cover approximately 70% of the earth’s surface, account for 90% of the earth’s ecosystems and hold 97% of the earth’s water. In marine ecosystems the primary driver of biodiversity loss is fishing, closely followed by sea and coastal land-use change. Only 3% of the ocean is now considered to be free from human impacts.
The vastness of the oceans have provided a significant buffer against the effects global warming by absorbing huge quantities of CO2 and heat. Between 2009-2018, the oceans absorbed 23% of global CO2 emissions, however absorption of CO2 comes at the cost of acidification, meaning a decrease in the pH level. Since the 1980s, pH has been decreasing by 0.017-0.027 pH units per decade. Acidification is known to reduce the ability of marine organisms to form hard parts such as shells and skeletons, affecting their ability to grow and reproduce, but the exact effects on different species and their ecosystems is not yet well understood. This situation is not easy to remedy: if CO2 emissions were to stop today, we would see a lag of one or more decades where acidification would continue and it is expected that it would take tens to hundreds of thousands of years for the oceans to return to a normal pH level. As a point of comparison, the largest extinction event of marine life occurred approximately 55 million years ago when global temperatures increased by 5-8 C with a rate of carbon emissions 16 times less than we have now, and over a course of 30,000 years.
The oceans are also estimated to have absorbed 90% of the energy accumulation from global warming between 1971 and 2010, which equates to a 0.11 C rise in the upper 75 m of water from 0.09-0.13 C. The effects of ocean heating are thermal expansion causing sea level rise (accounting for ~30% of the observed rise), increased melting of sea ice, increased stratification, reduced sequestering of atmospheric CO2 and altering of ocean currents and storm tracks. In 2019, the global average sea temperature reached the highest recorded value, and more than 84% of the ocean experienced at least one abnormally high temperature event.
Stratification occurs when the sea’s surface warms but the water underneath does not, or because runoff from ice melt leads to a layer of less-salty water. Such a differential prevents nutrient-rich water from upwelling and mixing with the warmer, lighter water that supports more biodiversity, depriving marine life such as corals and algae, from food.
Ocean heating also causes the upper layer to be deoxygenated because oxygen is less soluble as water warms, making it harder for marine organisms that depend on oxygen to survive. Water with oxygen saturation between 1-30% is called hypoxic which leads to the death of fish and invertebrates such as worms and clams. Water with oxygen below 1% is called anoxic. In 2008, it was estimated that there were 400 hypoxic or anoxic ‘dead zones’, totalling 245,000 km$2$. Compounding these issues are feedback effects: warming water increases the metabolic rate of marine organisms that produce oxygen causing them to respire more and generate less oxygen; additionally, the lack of nutrients due to stratification inhibits photosynthesis by organisms such as phytoplankton (microscopic organisms that create organic compounds including oxygen from dissolved CO2).
Because the oceans are so vast, it might not seem that deoxygenation and hypoxic areas pose a significant threat to marine ecosystems, but the area in which oxygen-rich waters occur is bounded by a naturally-occurring oxygen-minimum zone located beyond the continental shelves. The result is a narrow region of water on the coast of the continents, with only the upper part of the water column suitable for supporting most marine life. As hypoxic and anoxic regions grow, the part of the ocean supporting most marine life is shrinking, and the combination of deoxygenation and decreased nutrient supply is destabilising the base of complex food webs and ecosystems.
As if the effects of climate change on marine ecosystems were not bad enough, they are under attack from other issues including overfishing, eutrophication and pollution, and foreign species.
Fishing accounts for the extraction of approximately 110 million tonnes of fish and invertebrates every year, having increased from 28 million tonnes in 1950, and is the primary driver of biodiversity loss in oceans. Peak catches were in 1996 at 130 million tonnes, and have been declining at 1.2 million tonnes annually since then. Of these quantities, approximately 35% is bycatch and discarded and 12-18% is illegal and unregulated. More than 55% of ocean area is now subject to industrial fishing. Destructive and poorly-regulated practices like bottom trawling further cause almost irreparable habitat destruction for reefs, sponges and shellfish. These factors have led to a situation where 33% of fish stocks are caught at unsustainable levels, 60% are maximally sustainably fished and only 7% are underfished. Global populations of sharks and rays have declined by 71% since 1970.

Eutrophication is a particular kind of pollution where excess nutrients are deposited in water, typically by land runoff or direct discharge of nitrogen and phosphorus from fertilisers used in agriculture, in industry or from sewage. The effect is that water becomes stratified into a layer where phytoplankton and other algaes rapidly multiply to create huge blooms. These blooms lower the oxygen levels in the water, can produce toxins and reduce the sunlight entering the water. Blooms can last days to months, and when they die their decomposition further deoxygenates the water, creating longer-lasting effects. Globally, algal blooms due to eutrophication are becoming more frequent and more toxic, in 2018 there were 300 reported incidents reported worldwide.
There are many other forms of non-nutrient marine pollution, including any substance or object introduced that has a harmful effect on ecosystems. There are a vast array of non-nutrient pollutants, each with their own harmful effects, but including pesticides, herbicides, fungicides, hydrocarbons, oil spills, plastics, heavy metals, radioactive waste and hot water from power stations. Like nutrient pollution, non-nutrient pollutants typically come from diffuse sources such as land runoff, wind-blown debris, atmospheric emissions, shipping, and oil extraction. These sources include waste material or chemicals from industrial, agricultural and residential activities. Industrial activities that do discharge contaminants directly into waterways or by incineration, discharge them as airborne particles that eventually settle. For example: pesticides are widely used in plant agriculture and antibiotics and growth hormones in livestock agriculture, transport produces substantial oil and rubber residues, and domestic use of a variety of chemicals and medicines leads to contaminants eventually finding their way into watercourses. To give one example it is estimated that the amount of plastic pollution has increased tenfold since 1980, and that 4 to 12 million tonnes of plastic entered the oceans in just one year in 2010. The Great Pacific Garbage Patch is estimated to be 700,000 square km and containing 80,000 tonnes of waste.
The introduction of foreign species into non-native habitats is another form of ocean pollution that has dramatic, negative effects on marine ecosystems and biodiversity. The movement happens primarily via the ballast water of ships. When a ship is docked, it will fill internal water reservoirs to counterbalance cargo. When the ship arrives at its destination and has unloaded, it will discharge its ballast, along with whatever stowaways it contains, from fish to microscopic organisms. Plastics are being recognised as another vector for species movement, with organisms that can attach themselves to floating plastic debris such as jellyfish polyps and algae. Recorded invasive species have doubled in the last 50 years, and the threat posed is acknowledged to be one of the main drivers impacting global biodiversity.
Global warming
Global warming induced climate change has a broad impact on nature and interacts with many of the other drivers discussed, exacerbating the negative impacts. With an accelerating rate of climate change, it poses a significant and growing risk to nature and humans.
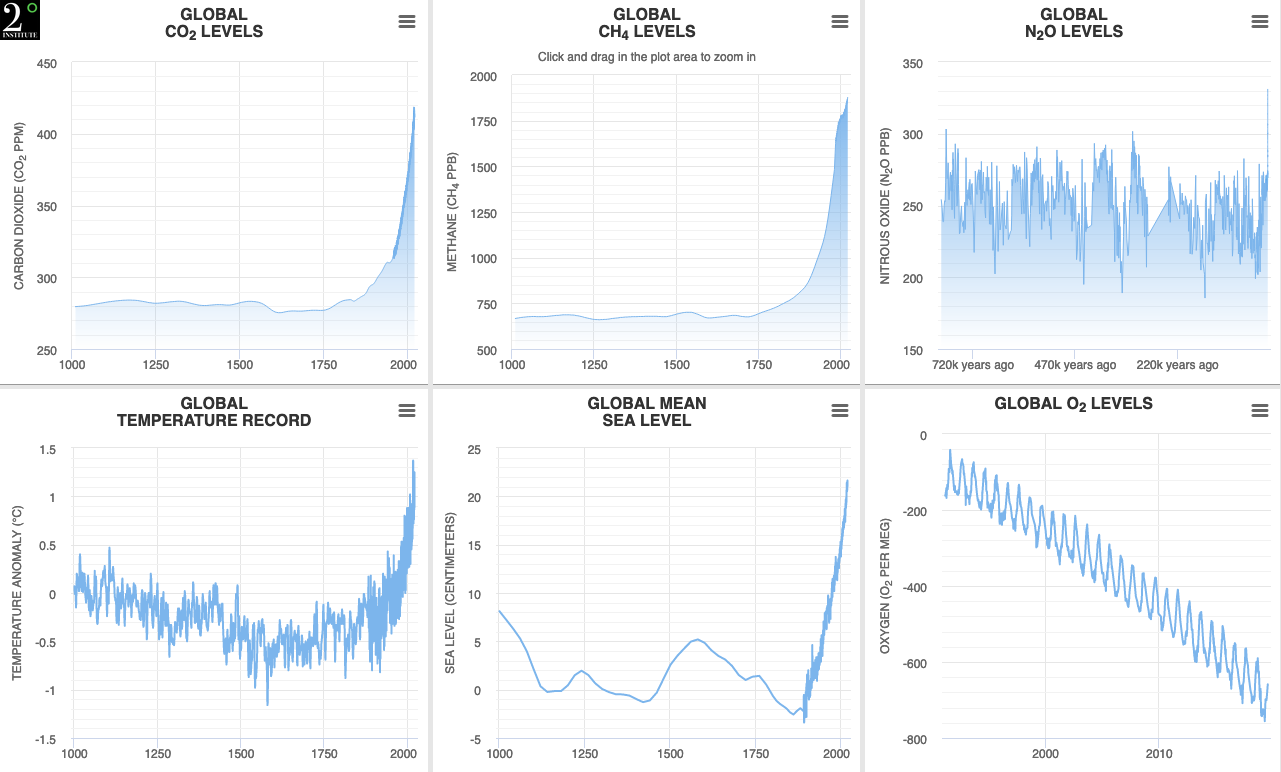
There are clear indicators of the drivers and effects of global warming due to anthropogenic emissions (hazardous emissions caused by humans), as shown by the charts below. Atmospheric concentration of carbon dioxide (CO2) is at 408 parts per million and 147% more than pre-industrial levels (PIL, of which 1750 is used as a representative baseline); methane (CH4) is at 1,870 parts per billion and 259% more than PIL; and nitrous oxide (N2O) is at 331 parts per billion and 123% of PIL. As a consequence, the global mean temperature and the global mean sea level are 1.2C and 20 cm higher respectively than PIL with year-on-year records being set. Temperature and sea-level rises are variable across the globe, for instance the Arctic has been experiencing sustained higher-than-average temperatures. The global oxygen (O2) level has been declining since it was first measured in 1991, approximately 0.05% higher than the present day.
The 2018 IPCC ‘Global Warming of 1.5C’ report sets out the current status and trajectory of planetary temperature. Humans have caused approximately 1.2C of global warming since pre industrial levels. Historical emissions of greenhouse gasses are likely to cause further warming of 0.5C over the next two to three decades, with effects persisting for millennia. In other words, the possibility of avoiding 1.5C warming is now vanishingly small, even if there was an immediate halt of anthropogenic emissions. This puts us on a pathway of warming from 1-2 C warming and beyond, which is predicted to have significantly worse effects compared with 1.5C until the end of the century, including:

- More frequent extreme weather events including heatwaves, heavy precipitation, severe drought, with effects including large-scale wild fires and flooding.
- Higher average temperatures, with increases being 2 to 3 times greater in some regions.
- More frequent ice-free Arctic, once per decade rather than once per century, with consequences for ocean circulation and more warming due to less reflection of heat (see 2012 ice extent image, showing a 12% loss per decade since 1979). 2020 has continued the trend with a later than ever ice-free arctic. Similar reductions in ice affect polar mountain glaciers and ice sheets.
- Increased sea level rise driven by ocean warming and melting ice: 10cm more by 2100, affecting approximately 10.4 million more people.
- Potential to trigger instabilities in the Greenland and Antarctic ice sheets, which would result in multi-meter sea-level rises.
These effects have consequent impacts in terrestrial ecosystems:
- Species habitat loss through reduction in their climatically determined geographic range, a total of 6% to 18% loss for insects, 8% to 16% loss for plants and 4% to 8% loss for vertebrates. Some species will adapt by moving further north, but some will not be able to. Other species will exploit the opportunity, to move into areas once too cold, often with detrimental effects.
- Transformation of terrestrial and wetland ecosystems, such as the expansion of desert, is 13% globally, vs 4% at 1.5C.
- Thawing of permafrost with an area of 1.5 to 2.5 million km$^2$, which is approximately 40% of the arctic’s permafrost.
In ocean ecosystems:
- Tropical coral reef loss is almost total at >99%, compared with 70-90% lost at 1.5C.
- Substantial changes to ocean chemistry leading to acidification, hypoxia and dead zones.
- Increasing numbers of jellyfish, particularly in blooms.
On water resources:
- Increase in water scarcity by up to 50%.
- Reduced food security caused by reduced crop yields, reduced fisheries (twice the level of decline compared with 1.5C) and reduced production livestock.
- Substantial decline in fisheries productivity at low latitudes.
And impact humans as well:
- Substantial increase in human exposure to flooding, affecting 10 million more people.
- Increased negative consequences to human health due to heat, diseases and malnutrition, with greater risks in urban areas.
- Pest species such as mosquitos and ticks that spread disease, and locusts and beetles that ruin crops.
- Increased poverty.
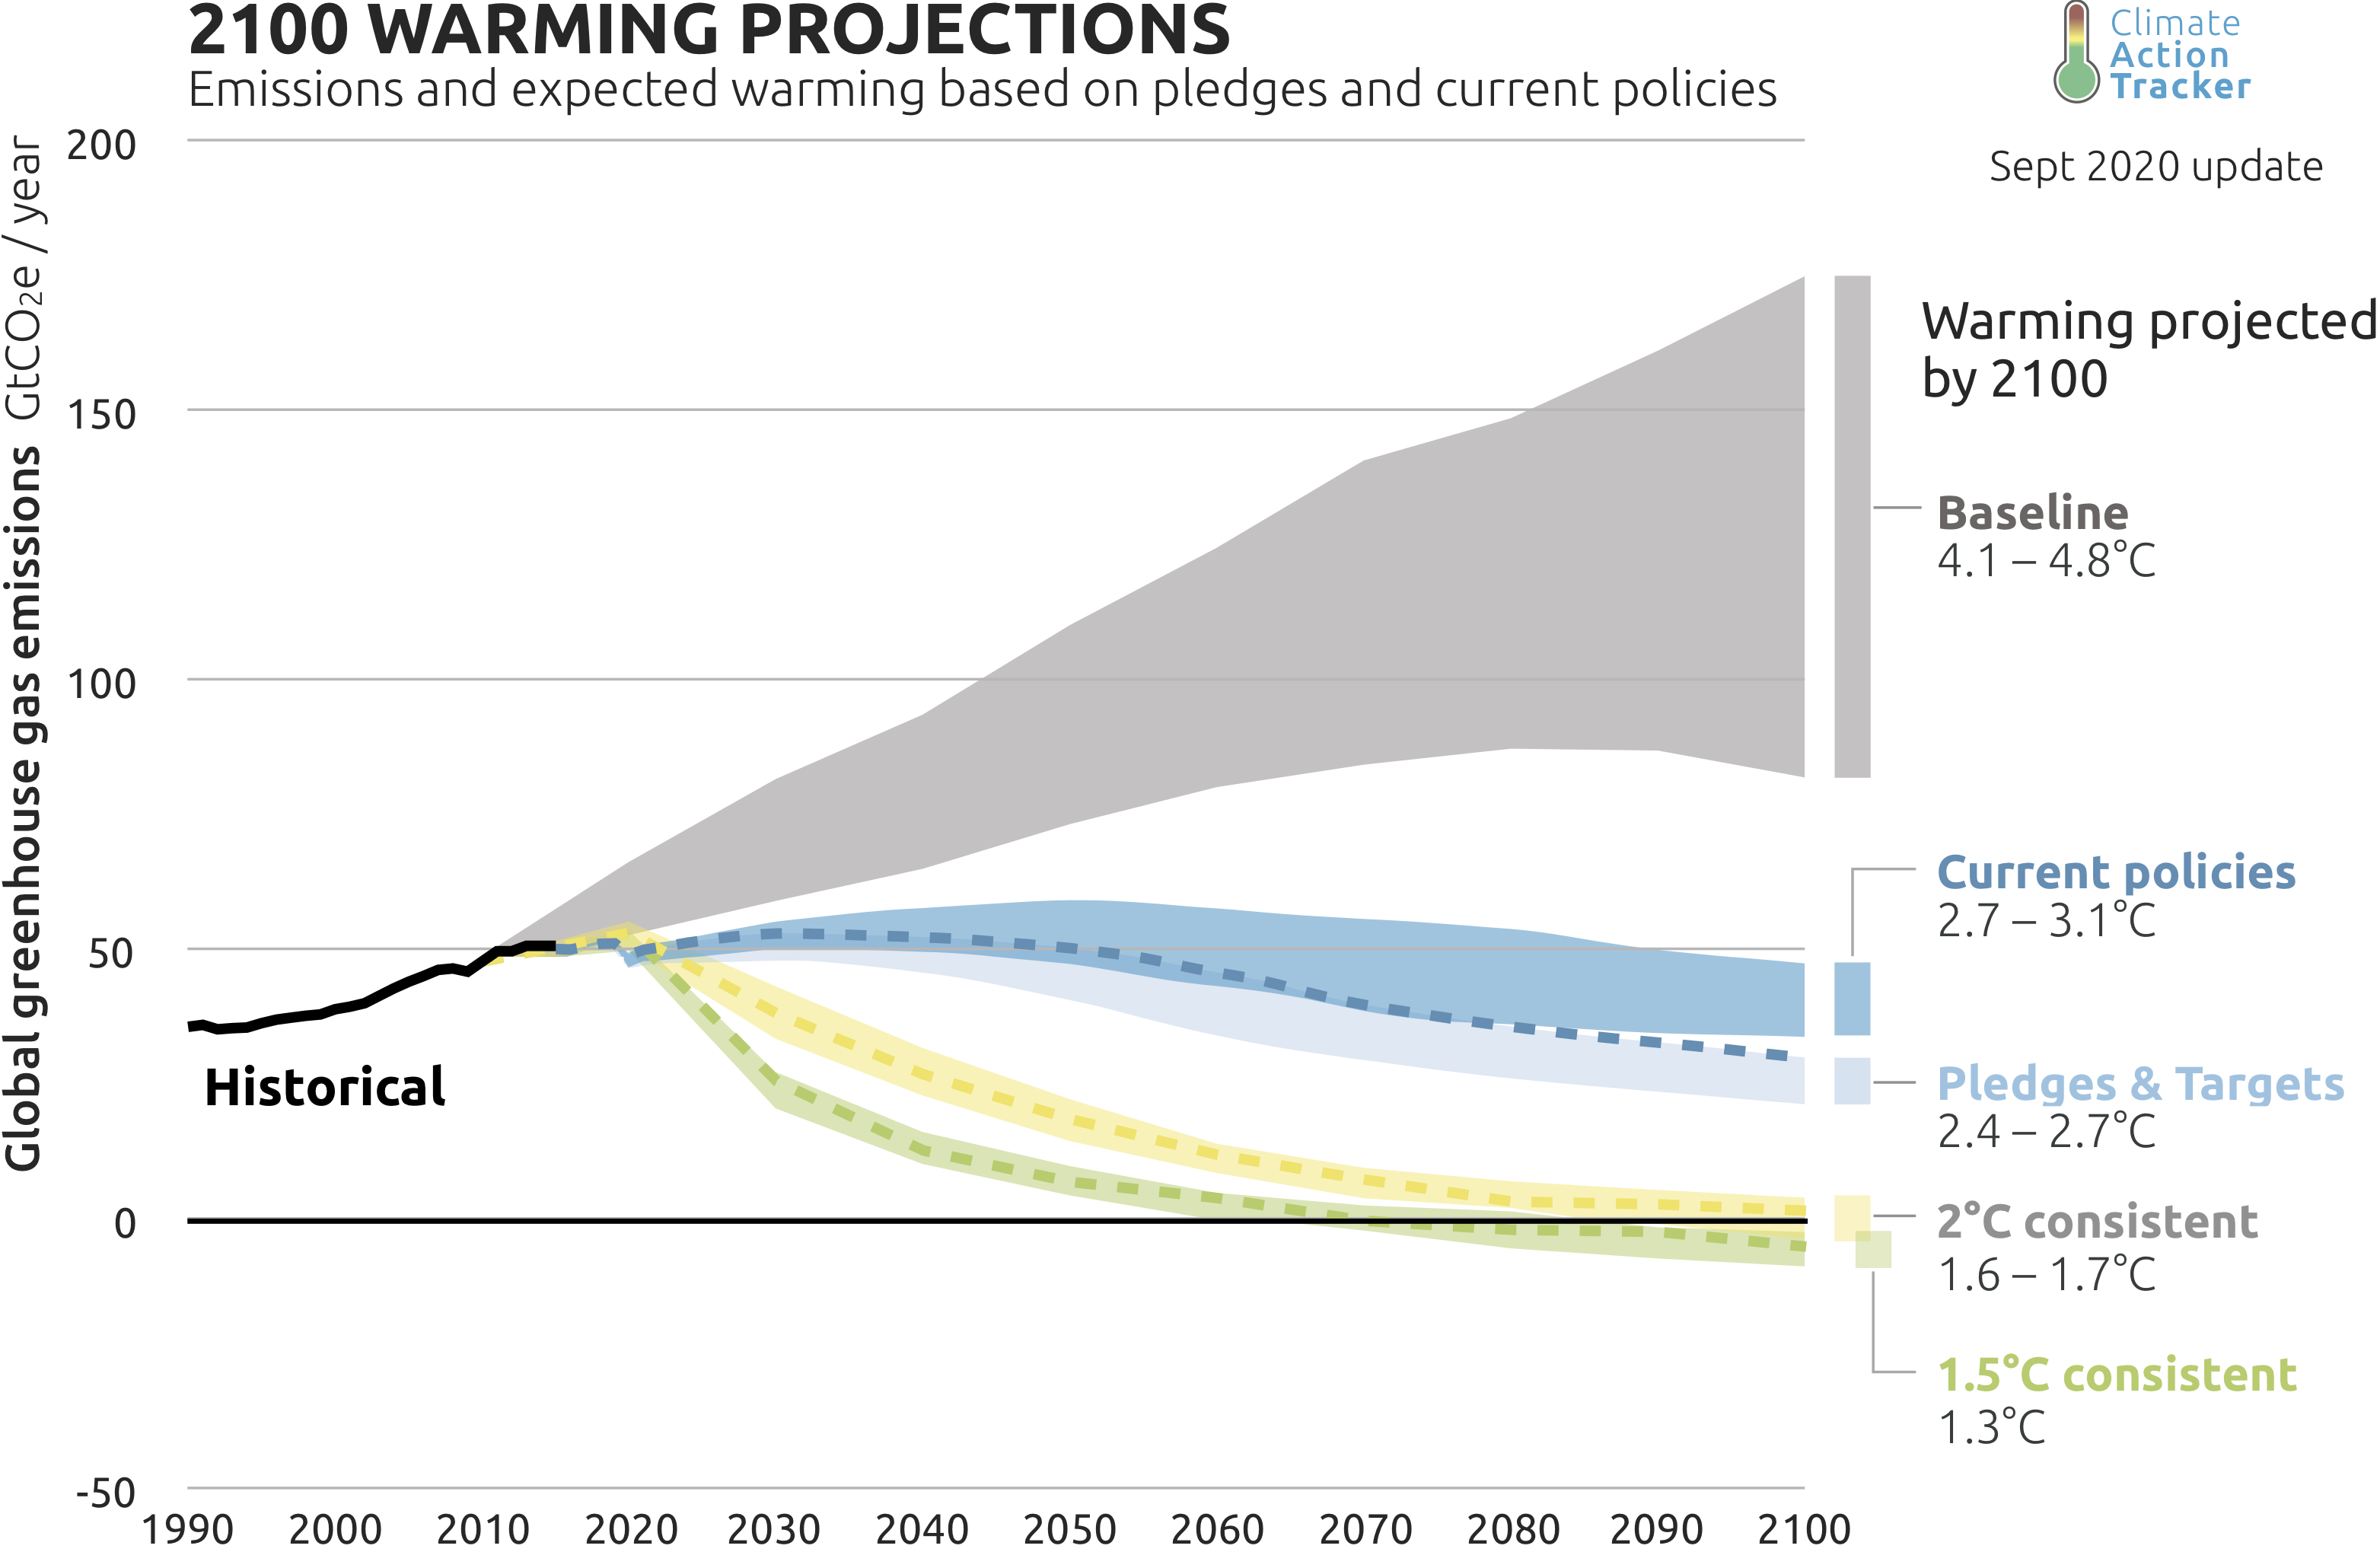
Limiting global warming to 1.5-2 C requires nothing short of immediate and dramatic reductions in global emissions to reach net zero CO2 and similar reductions in gasses such as methane, but policy and aspirations fall short of the change necessary. The charts below illustrate the different pathways that can be taken, and this stark contrast: current pledges and targets fall 50% short of the expected reduction of emissions to limit warming to 1.5 C under the Paris agreement and 30% of the expected emissions for 2 C. By the end of the century, we will end up with around 4 C of warming if we carry on as normal, but still almost 3 C with the realisation of current policy and pledges.

Final thoughts
This note attempts to concisely and objectively summarise the issues surrounding human impact on nature. Since I’m not an expert, it necessarily skims along the top of what are hugely complex issues. What I do hope however is that it conveys the magnitude and gravity of the situation for nature on earth and how the contributing issues are deeply interconnected.
Climate change is now beginning to be taken more seriously and is increasingly becoming part of normal discourse. But the declines in biodiversity and ecosystem services are generally poorly understood and regarded as risks, but currently have a disproportionately greater impact on humans with issues such as access to freshwater, air pollution and protection from extreme weather. The UN Global Assessment Report finds that negative trends in nature will continue until 2050 and beyond due to the projected impacts of increasing land-use change, exploitation of organisms and climate change under current trajectories. These impacts will also be distributed unevenly and will affect many of the world’s indigenous people and poorest communities first.
The ongoing assessment of the state of nature and modelling of the future are imperfect and we cannot fully understand the consequences of human actions. What we can be sure about however is that our situation is unprecedented in history. Measured against the earth’s history, the time frame for these effects to become catastrophic is just a blink of an eye. Should things change dramatically tomorrow, many of these impacts are locked in for decades. Momentum to mitigate these issues is building but will it be enough, and in time?
The UN report concludes that avoiding such a scenario requires systematic, transformative change across across economic, social, political and technological factors. Everyone has a part to play.
References / further reading
- Climate Action Tracker, 2030 emissions gaps.
- Climate Levels, live graphs of atmospheric concentrations of greenhouse gasses and global mean temperature, sea level and oxygen level.
- Deep Adaptation: A Map for Navigating Climate Tragedy, Jem Bendell, 2018.
- Global biodiversity outlook 5, Secretariat of the Convention on Biological Diversity 2020.
- Global Fishing Watch
- Global Forest Watch
- Global Warming & Climate Change Myths
- Global Wetland Outlook: State of the World’s Wetlands and their services to people, Ramsar Convention on Wetlands 2018.
- Ocean Pollution: Causes and Effects, Deep Ocean Facts.
- One Ocean Project, issue briefs
- State of the World’s Forests 2020. In brief
- Stung! On Jellyfish Blooms and the Future of the Ocean, Lisa-ann Gershwin, 2013.
- Swiss Re Institute’s report on Biodiversity and Ecosystem Services: A business case for re/insurance (Guardian coverage)
- The future is grim, Cache Baba, 2019.
- UK National Ecosystem Assessment (2014).
- UN Global Assessment Report on Biodiversity and Ecosystem Services (UN blog article with good summary of facts) (Guardian coverage)
- UN Global Environment Outlook 6, 2019.
- UN Global Land Outlook, UN Convention to Combat Desertification (UNCCD), 2017. (Guardian coverage)
- UN State of The World’s Forests 2020 report, UN Food and Agriculture Organization.
- WWF Living Planet Report 2018: Aiming Higher (Guardian coverage)
- WWF Living Planet Report 2020: Bending the Curve of Biodiversity Loss (Guardian coverage)
- World Meteorological Organization, Statement on the State of the Global Climate in 2019
- World of Change, satellite imagery of the changing Earth surface from NASA Earth Observatory.